Seismic Mini-Arrays for the NVT study
NVT in Mexico
Nonvolcanic tremor (NVT) are the episodes of seismic radiation (mostly in 1-10 hertz range) likely associated with aseismic slow slip events within the transition zone between the seismogenic coupled and deep free-slipping segments of a fault. NVT has been observed on the San Andreas Fault and on some subduction thrust faults in Japan, the United States, and Costa Rica. To learn more about NVT, Payero et al. [2008] studied data from from the broadband seismic stations in the Mesoamerican Subduction Experiment (MASE) transect across the subduction zone in central Mexico that is overdue for a major earthquake and has been well-monitored with Global Positioning System (GPS) networks.
GPS data show that two large slow slip events occurred in the Guerrero-Oaxaca region, one in 20012002 and the other in 2006. Seismological analyses revealed that NVT activity was higher during those two slow slip events compared to that for the "quiet" period of 20032005. Models suggest that NVT might be related to low-temperature metamorphic processes and dehydration of the subducted oceanic crust.
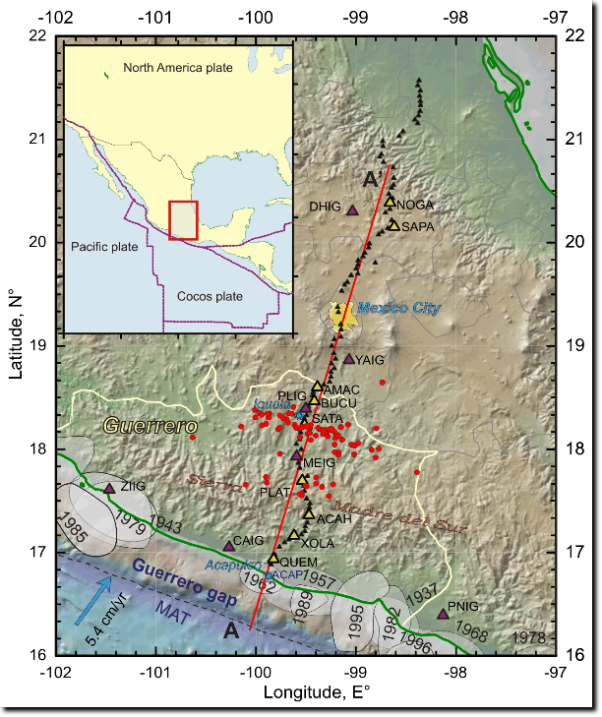
Figure 1. (inset) Location of the study area and plate boundaries. Seismotectonic setting, seismic network configuration and NVT locations. Rred circles are epicenters of NVT bursts estimated from the analysis of MASE data (small triangles indicate the positions of broad band seismic stations). Large dark (purple) triangles show locations of the broad band stations. Large light (yellow) triangles denote the MASE stations for which the records are shown in Figure 2. Line A-A denotes a location of profile presented in Figure 2. Shaded areas along the coastline annotated wit the years are approximate rupture areas of the most recent major thrust earthquakes (M >6.5 ) in the Guerrero segment of the Mexican subduction zone [Kostoglodov and Pacheco, 1999]. MAT is the Middle American trench. Arrow indicates NUVEL1-A relative Cocos-North America plate motion vector [DeMets et al., 1994].
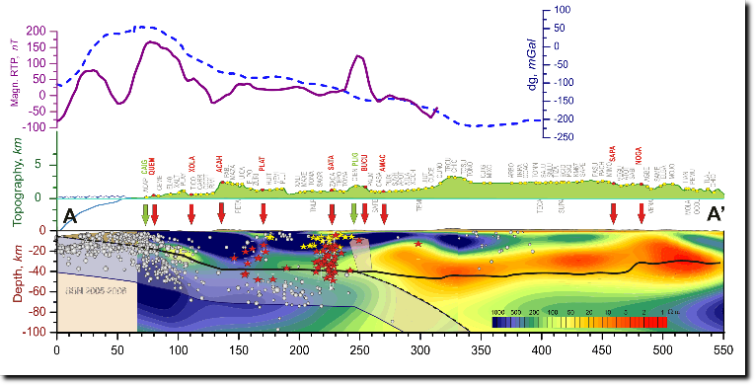
A-A0 transect (Figure 1) that shows locations of MASE and SSN stations on the topography profile. Solid and dashed lines in the bottom graph illustrate the Cocos-North America tectonic plates interface and Moho [Clayton et al., 2007]. Red and yellow stars are the NVT hypocenters projected on the A-A0 vertical cross-section plane (yellow stars denote poorer estimated NVT with the depth errors more than 30 km). White circles are the projection of the earthquake (M > 4) hypocenters from the SSN catalog for 20052006 epoch. Shaded polygon area located in the continental crust, above the tip of the mantle wedge (~250 km from the trench) stands for a probable mega-intrusion of lower density and high magnetization which can explain the gravity and magnetic anomalies shown in the upper chart. Background image is a resistivity model (digital image is a courtesy of A. Jording).